
You setup a new site, perform a heat map using wireless heat mapping software, document and generate a beautiful report. Shows how the signal looks in different areas. Validate the wireless coverage and all is ready.
Although we can use offsets when displaying this collected data, it is not accurate. Now keep in mind, I am not saying that it is wrong or invaluable; stating that it is not accurate. For example, you can perform a survey, leave the building, RRM runs, channel and power levels change; data you collected no longer applies to the current state of the wireless.
How can I determine the current state of wireless? It wouldn’t make sense to perform another heat map. All that costs time and money; so how do we resolve this?
Beam Density Map:
In Mist UI, under “Location” there is a sub-option, “Location Diagnostics”. I paid little attention to this feature. While trying to review different features, I realized how valuable this option can be for the first call support agents and the WLAN engineers.
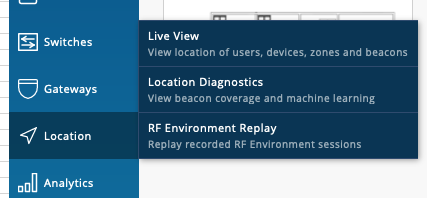
Once you follow that sub-option, the following screen appears:
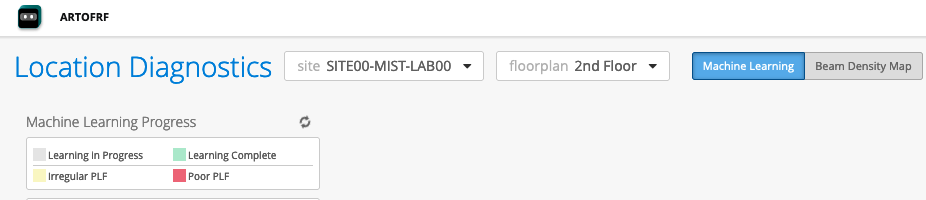
I highly recommend reading through the location documentation located here, and listen to Bob Friday (Founder of Mist) talk about ML and BLE here.
Next I clicked on the “Beam Density Map”

Changed the values to “Wi-Fi”
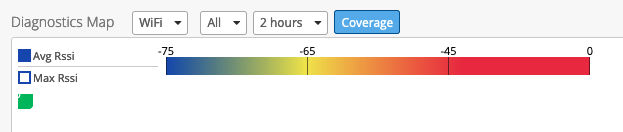
There are 4 options present, 1 hour, 2 hours, 6 hours and 24 hours. I picked two hours for this test.

NOTE: I do not have my access points installed according to proper Mist guidelines. This makes my location data less accurate; however, I can say it may be precise.
This is real-time data showing me exactly where the client’s/users have been using Wi-Fi and what their signal looks like. I have looked at this data multiple times daily and it precisely shows some of the key areas where we use the Wi-Fi.
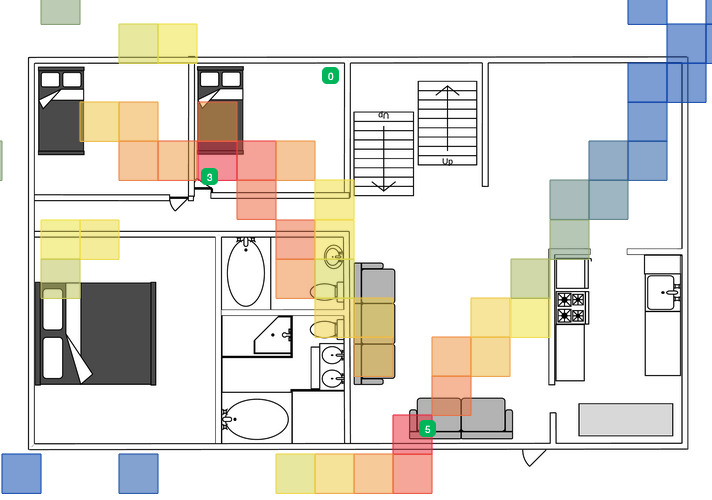
As I hover my mouse over different blocks, I can see what RSSI clients experienced in different areas.
I normally use my phone in the main bedroom on the left-hand side. RSSI shows approximately 64 dBm to -67 dBm. I fired up my Airport Utility in that area to see how close these results were. A quick scan shows -66 dBm to -70 dBm; which is very close to what I see in the Mist Dashboard.
